
To understand Vector vs Bitmap Graphics we will have to look at them separately. And we will definitely do that but first a few basic things we must clarify. usually, this concept is only partially understood and the implications of the same reflect in the workflow and output of a graphic designer. This post will cover aspects in context with graphic designing, not computer engineering.
The main difference in Vector vs Bitmap Graphics, to begin with, is below (slide from left to right). But if you really are curious about learning read till the end.


What is Vector Graphic?
Vector quantities have magnitude as well as direction. This is what we learnt in 12th grade physics. but how does it apply to computer graphics? When we look at a visual on computer screen, essentially its a representation of binary data. The binary data is converted into a visual with the help of a programme which understands the file format.
In simple terms, vector graphics are shapes/combination of shapes created based on mathematical formulas. It’s like imaging a circle in your head and be able to communicate it with its exact representation with a description that can be understood by somebody else. To make somebody exactly think about the circle you are imagining seems very easy but still it has many details that needs to be passed on correctly. such as it’s
- Radius/ Diameter
- Fill color
- Outline color
- Thickness of the outline
- Outline Color
- its position on the surface
- Its local (0,0) position
I bet you have not thought about all the above when we were talking about imaging a circle and communicating it to someone else. I have just taken the absolute essentials to define it and left many more attributioins aside such as texture, shadow, gredient, alignment of outline weight, etc.
What we learn from the above scenario is that it takes a lot things to think and describe a circle flawlessly. But computer can do the same much faster, accurately and way more complex shapes than a circle. Because it does not imagine a circle based on euclidean geometry but on the basis of the 2-dimensional cartesian coordinate system. where the graph is plotted against x and y-axis and location is mapped on the basis of point coordinates. Then those points are joined to form shapes or create open splines. Every point must have information about its location and angles on which adjoining line segments will meet. so Now do you get it? Location & Angles… are serving as Magnitude and Direction.

So to sum it up! Vector graphics require the Location of its anchor points and angles on which the line segments will be connected to build shapes or open splines. The more detailed shapes are the more anchor points will be needed thus resulting in heavy file size. But compared to bitmap data it’s negligible.
To make the above point clear. understand that if you want to increase the size of a circle, defined in a file stored in vector format all you have to do is increase the diameter figuratively. You can change the diameter of the circle from 1 inch to 1 foot or 10 km. The file size will not change.
Important note
All the digital screens work based on the bitmap representation of visual data. which simply means that even if you are creating a resolution-independent artwork in Vector editing software (Corel Draw, Illustrator, Inkscape) it will be displayed and seen on a resolution-dependent device. you can definitely zoom in or scale it as much as you want without visible pixelation but it’s just recreating the artwork. what matters is the scale on which you are going to output the file for printing. Printers [hardware, not the guy who runs the printing shop ;)] can only understand and spool bitmap data. However, there are exceptions but we are not gonna digress from the main topic here. Let’s see what bitmaps are made of then we will compare both.
What is Bitmap Graphic?
Bitmap Graphic is fairly simple to understand. Bitmap is otherwise also known as Scaler or Raster graphics. To understand the Bitmap we have to break it into the words from the combination of which it is made.
Bit + Map. Bit means the amount of data (it may sound overly simplified here but the techies forgive me, I am trying to keep it simple for designers). The map refers to some sort of system to locate a specific location within an area.
Well concluding from the above bifurcation we can say that essentially Bitmap is all about placing data at a specific location within a defined area. So imagine a grid drawn on the floor and you have to put objects on those grid boxes. To communicate to someone else about the position of a particular gird box you will have to come up with some sort of notation/ language/ schematics. The easiest way would be to just mark the Column & Row Headers with alphabets and integers like the way it’s done in an Excel spreadsheet. That way to refer to a specific cell, we just have to combine the headers of the respective column & Row the cell belongs to.
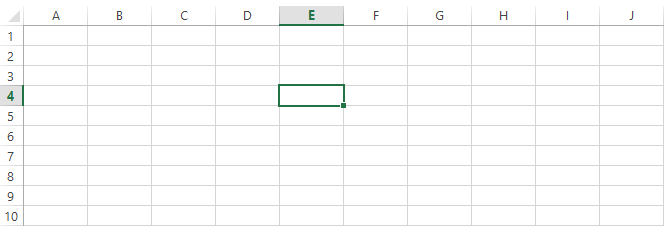
The above screenshot represents how one particular can be located by storing the information as E7. This is the basic logic around which bitmap graphics are built.
We have already talked about Mapping the location where data is supposed to be kept. Now let’s have a look at the kind of data a bitmap graphic supports. Think of the cells in the above image as partitions of the screen and each one of them as single pixels. Very often you will hear that bitmap graphics are made out of pixels and they are resolution-dependent. we will try to understand that as well but before let’s focus on one single pixel.
A pixel is not something that should be measured but it is supposed to be counted. you will hear phrases like Pixel Count, Pixel Density, etc. but whenever you come across a discussion where the size of the pixel is used to represent the quality of the graphics then they either don’t know what they are talking about or they may just figuratively using it. In actual it’s all about the size of the screen and pixel density it supports. The higher resolution it supports the higher pixel count it will have and the higher density will be. That means that the screen is competent for representing more detailed images. However, we will look at the screen in more detail in a separate post.
Pixel contains information about the color it will have and its location on the pixel grid. These are the only data it requires in order to be correctly rendered on screen. In a separate post we will discuss color in detail but for now, just consider it as a value that can be stored as a code in the computer’s memory and can be recalled whenever needed. There are many image formats that support raster data such as JPEG, PNG, BITMAP, GIF, etc. All of them are unique and have some properties in terms of capacity to hold the amount of color information, transparency, Interchangeability of images, etc. But essentially all of them are dependent on one common thing which is a pixel. So the amount of visual detail that can be captured in an image will depend very much on pixel count.

Above is an example of how bitmap graphics behave if zoomed in. The icon of the car starts showing it’s pixels details when it is blown out of its optimal resolution. Since we have now a better understanding of Vector & Raster graphics separately let’s draw a comparison and review our understanding.
Difference between Vector and Bitmap graphics?
Vector vs Bitmap Graphics
| Bitmap Graphics | Vector Graphics |
| Resolution dependent ( Based on the resolution of device and software the preview will depend on) | Resolution independent (if opened in a native software which supports vector data display the resolution will not matter) |
| Based on pixels ( Graphic pixelates while transforming to a larger size or if viewed on a higher zoom level | Based on mathematical formulas, the Cartesian coordinate system (no pixelation) |
| Comparatively required larger memory space ( File size is larger) | Comparatively required lesser memory space (also depends on the complexity of objects and no. of objects) |
| Can contain a huge amount of multicolor information and complex organic shapes in a form of pixel cluster | Not suitable for a huge amount of color information. Organic shapes and details are not rendered as real life |
I have tried to list down the main differences however there are many more but they will automatically come to you once you start working with various software. I hope this gave you enough information to start digging more into the topic. keep coming back for more stuff related to design software and tech in general. would appreciate it if you would consider joining the mailing list (in the footer).